Reading Time: 4 minutes
I’ve been meaning to take part in Makeover Monday for some time as a way to improve my data storytelling skills. This weekly learning event has been running for a year or so and I love its simple but effective format: a data vizualisation and accompanying dataset is released at the start of each week and you simply read the brief, analyse the dataset and make over the visualisation, submitting your work into the Twitter dataviz community for feedback. I am a big fan learning by doing, so while a 10 week Coursera on Data Vizualisation might be interesting, I don’t think it would be nearly so useful as just getting stuck in with some open data sets and trying things out, getting feedback from the dataviz community and iterating your work. Active and social learning at its best!
My first attempt was pretty daunting. I had previously aborted a Makeover Monday attempt a few months back when I had some good ideas on how to present the data but tried using Google Studio to create my viz and got totally stumped with it. This time I used Tableau Public and it was really easy to pick up. I have lots of experience using Excel pivot tables and the concepts from that work held me in good stead with Tableau. The original viz being made over is below. I spotted some obvious problems with the original: it just presented the source data but didn’t really tell a story; and there we no obvious calls to action despite the data being generated by a campaign group.

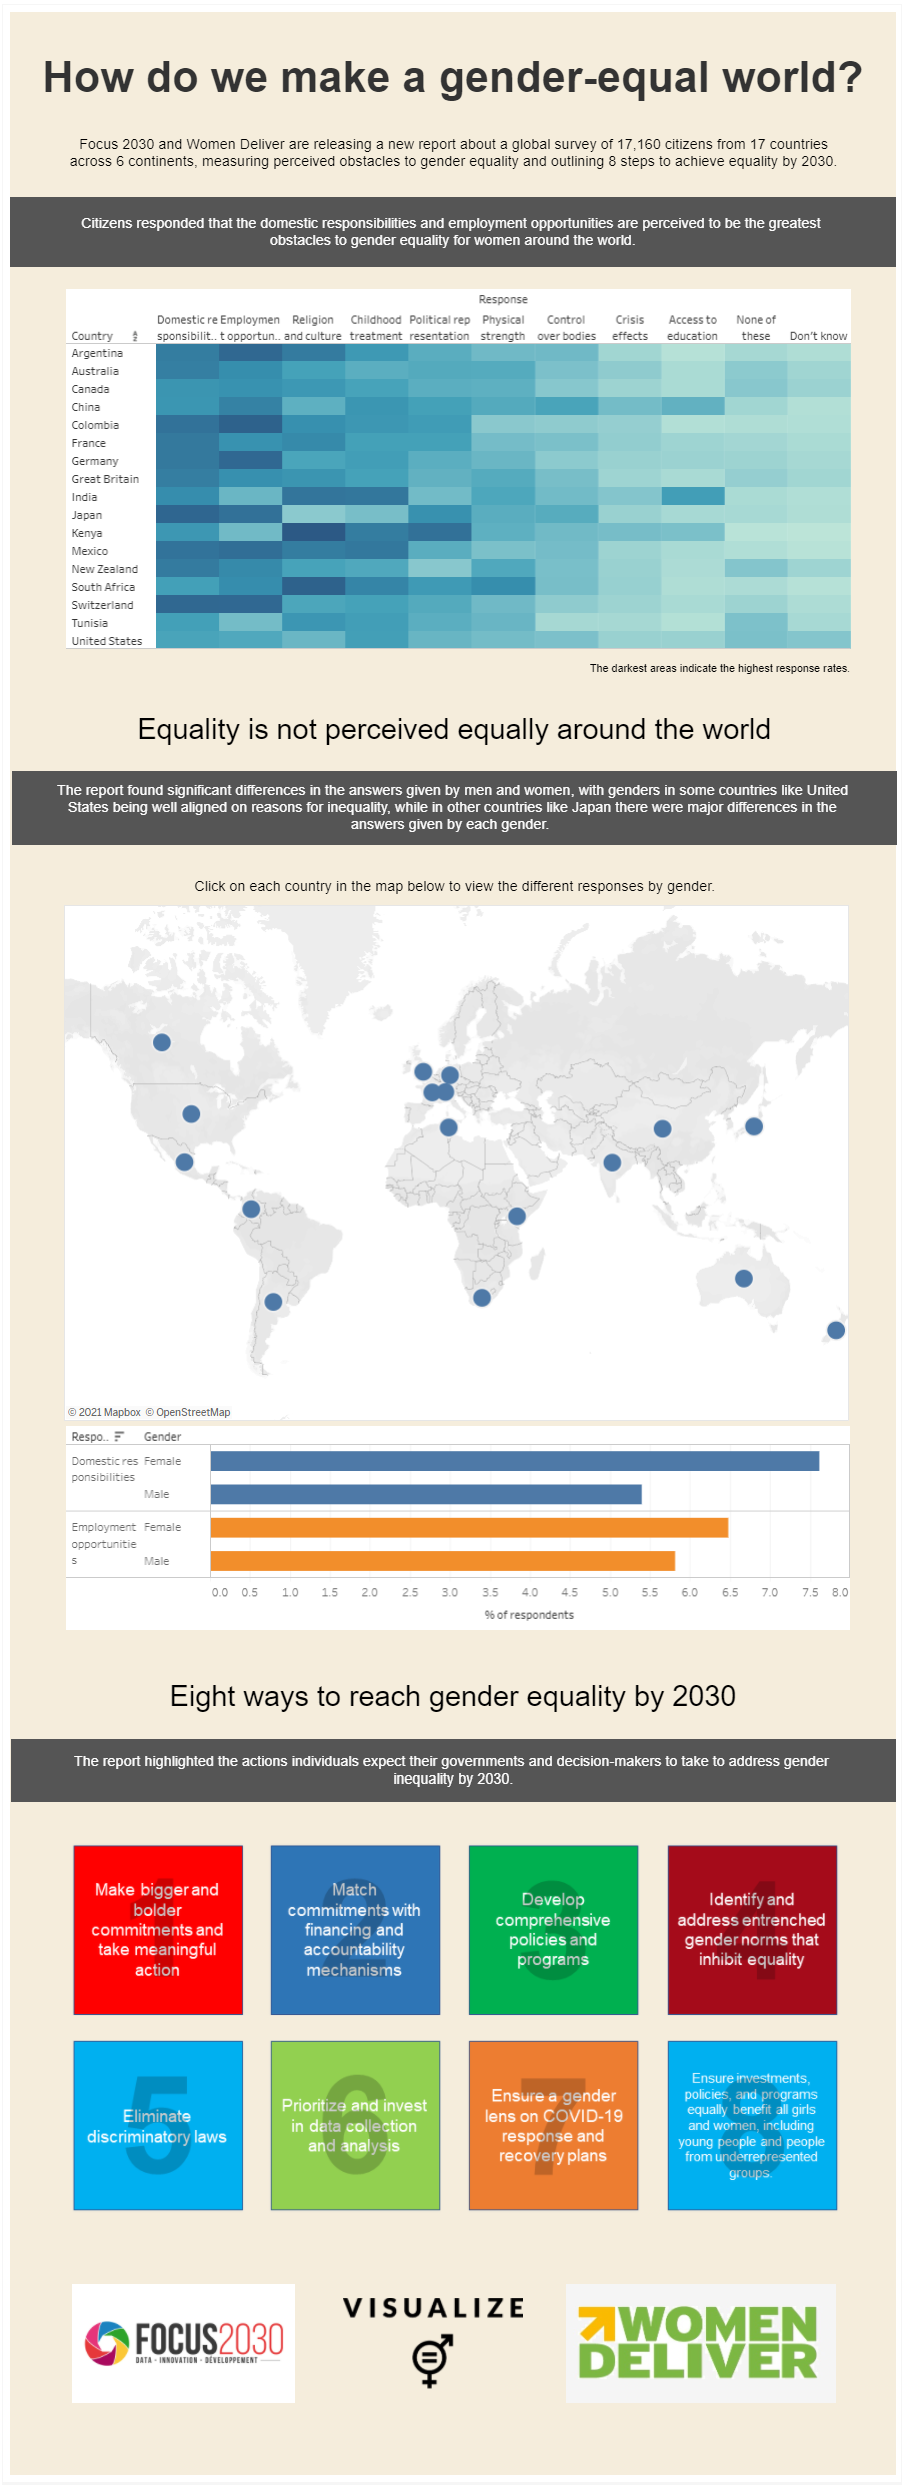
I spent about 2.5 hours making this over, about half of which was spent learning the basics of Tableau. I wanted to tell a story with the data there was no time axis to build a narrative around, the dataset was a snapshot of 17000 people’s perceptions of gender inequality at a specific point in time. My view on the ‘story’ is that it’s the first survey of this size done on global citizens; that employment opportunity and domestic roles are the two biggest perceived barriers to gender equality globally; and that the commissioning organisation had created an eight step plan to rid the world of gender equality by 2030. So I tried to get those three key points across.

I was fairly pleased with it as my first ever attempt at a dataviz and compared with what some other people presented on Twitter I think it stands up ok, but it also really makes me cringe! Firstly it’s far too wordy. Secondly, it’s not visually pleasing at all, I did try to use some of the organisations brand colours but didn’t have any time to spend on visual design, not that visual design is my skillset anyway, but I think to make a good dataviz I’ll need to improve my game on that front substantially. Finally, I just don’t think it tells the story strongly enough. Publishing it to Twitter as is the way for Makeover Monday was absolutely terrifying, showing the world my awfully designed dataviz, but you’ve gotta start somewhere!
The discussion session on Wednesday evening gave me lots of useful ideas for improvement including:
- Make the layout portrait mode with more vertical space to use
- Be careful of cognitive overload – include plenty of whitespace, keep text size to 11 or 12 points and if there is too much on screen then think about what can be eliminated while still maintaining the narrative arc
- Use a snappier title that boils down the message from the narrative
- Don’t put too much text up front, instead grab attention with the key finding and then add narrative
- When using maps and a related chart, use actions to connect them, and don’t forget to use clear instruction text so the user knows what to do
- Put any call to actions at the end and make them visual, for example a grid with icons or numbers rather than a bulleted list
- Add the logos of all involved organisations
Following that discussion, I spent a few hours on my iteration. Again, about half the time was spent learning Tableau features and I had a good crack at putting the above learning points into action and came up with something I’m a lot more pleased with. I’ve still got a long way to go, especially around chart formatting, but am pretty happy with this first finished attempt. And as an active learning experience with support from the Makeover Monday team and community, and some reflective blogging, nothing can beat this as a learning experience!
The below is a static image, you can view the interactive version on the Tableau Public site where you can click around and explore the data.